Sell Wall
A Sell Wall is what you see when many tokens are listed near the floor at once. It tells you holders want out — and the price is unlikely to move up until those listings clear.
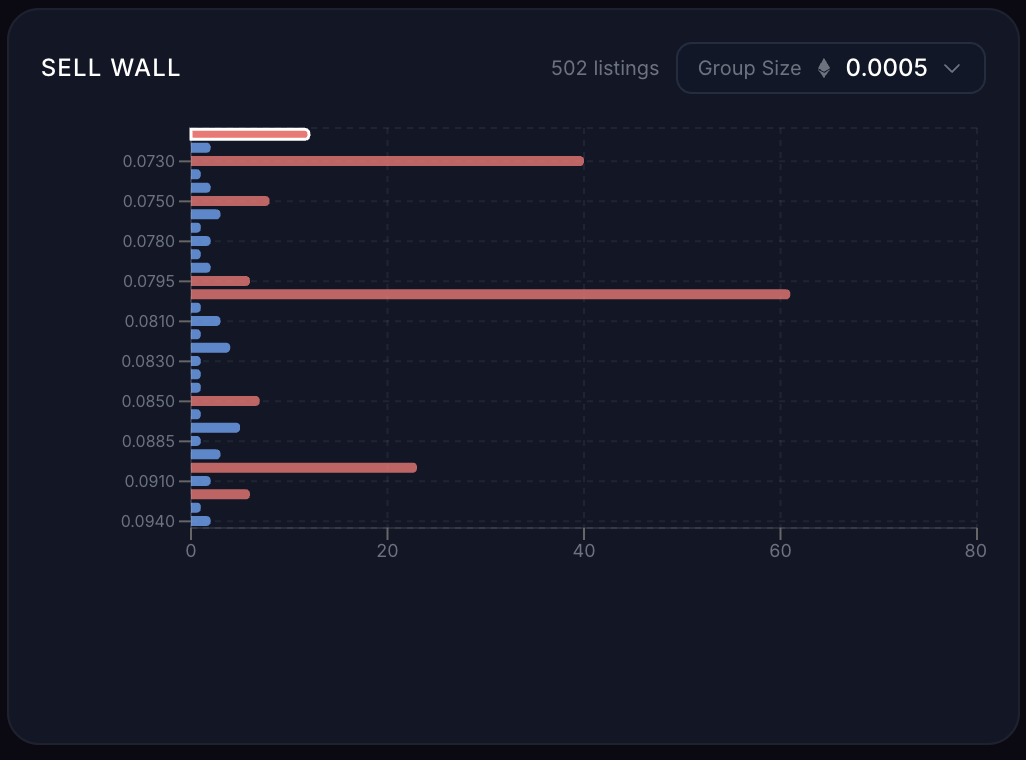
How to read the chart
- Y-axis — ETH price points, grouped into buckets
- X-axis — number of listings in each bucket
- Red bar — more than 5 listings in that bucket (a cluster)
- Blue bar — five or fewer listings (background noise)
- White outline — the bucket containing the current floor
Total listing count is shown at the top right.
Group Size
The Group Size dropdown controls how wide each bucket is, in ETH. Daily-Mints picks a sensible default per collection (around 1–2% of the floor), but you can switch between 0.0001 ETH and 1 ETH to zoom in or out.
Smaller buckets show micro-clusters. Larger buckets reveal the broader supply distribution.
How to read it
- Big red bar at or just above the floor → strong sell pressure, floor likely drops
- Many small blue bars spread out → healthy distribution, no concentrated exit
- Empty buckets near the floor, listings only further up → low pressure, holders are confident
When it matters most
Right after reveal is when sell walls explode. Most mints dump after reveal — see Your first mint for the exit strategy.
Next steps
→ Mint Card explained → Glossary — quick definitions